Google Analytics Introduces a New Dashboard Feature

Google continues to introduce new features across its analytics and search tools. This time, Google Analytics (GA4) has introduced a new Dashboard feature designed to make data analysis more convenient and efficient.
The new dashboard allows users to create a customized view of their analytics data based on their specific needs. Instead of navigating through multiple reports to find frequently used information, users can bring important metrics together on a single page.
Key Features of the Google Analytics Dashboard
The new GA4 Dashboard comes with several features designed to simplify the way users organize and monitor website data.
1. Integrated KPI View on a Single Page
One of the main advantages of the Dashboard feature is the ability to display multiple Key Performance Indicators (KPIs) in one place.
Users can bring important metrics together on a single page, reducing the need to repeatedly open different reports within Google Analytics.
This can make it easier to monitor important website performance indicators at a glance.
2. Grid-Based Canvas Layout
The GA4 Dashboard uses a grid-based canvas that allows users to arrange charts and data elements manually.
Users can organize different visualizations, adjust their alignment, and use custom dimensions according to their reporting requirements.
This flexible layout makes it possible to create a dashboard that matches a user’s specific workflow.
3. Drag-and-Drop Functionality
Creating a dashboard is also made easier with the drag-and-drop feature.
Users can select the dimensions and metrics they want to analyze and then drag them directly onto the dashboard canvas.
This provides a more straightforward way to build a customized report without having to configure every element through complicated menus.
4. Publish the Dashboard Directly
Once a dashboard has been created, users can save it and choose whether they want to publish it.
This can be useful when a dashboard needs to be used as a regular reporting or monitoring tool, particularly when working with website performance data.
How to Create a Dashboard in Google Analytics
Creating a customized dashboard in GA4 can be done in a few simple steps.
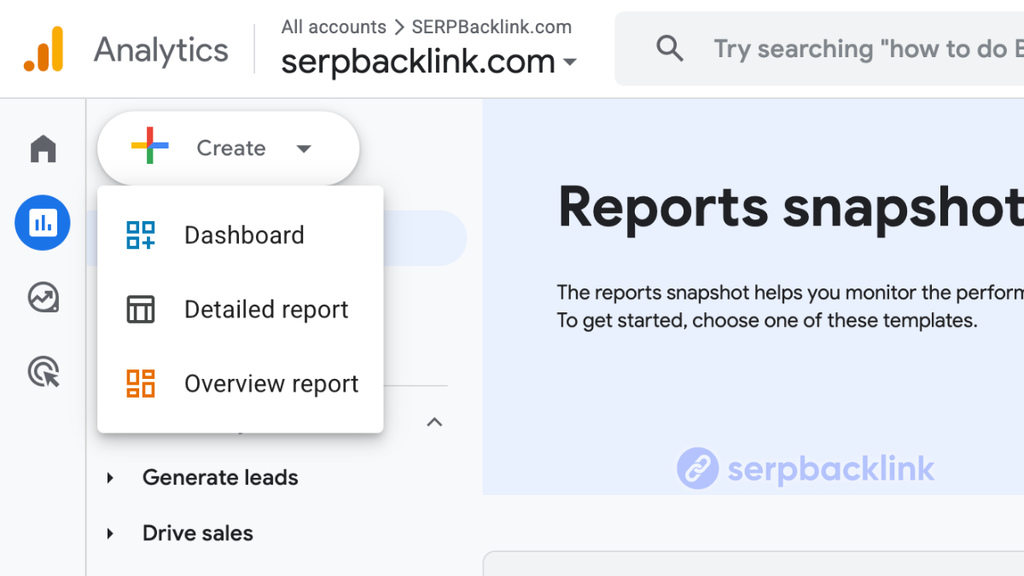
1. Open the Dashboard Feature
First, open Google Analytics and select the Create button. From there, choose the Dashboard option.
2. Select the Data You Need
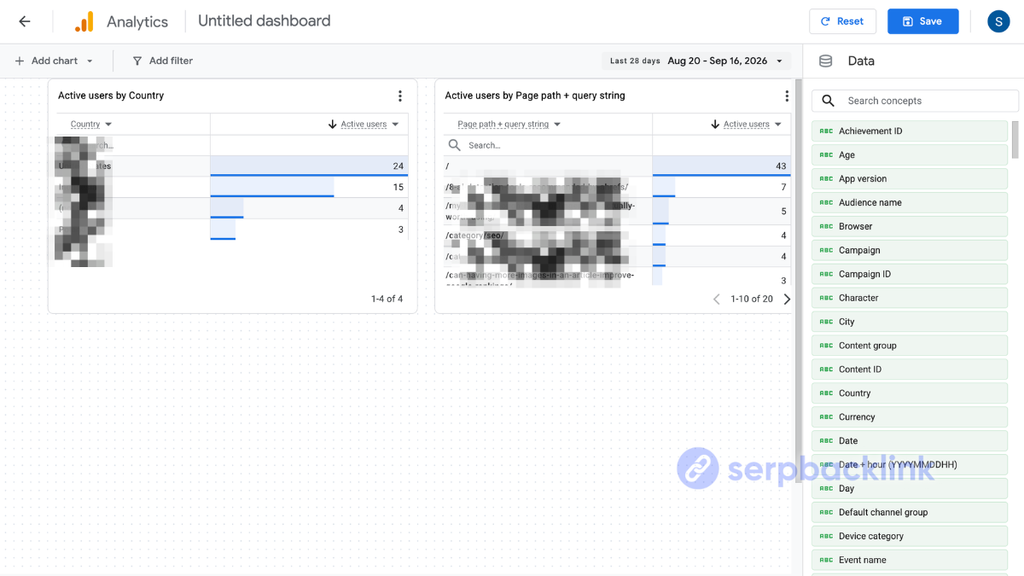
Next, choose the dimensions and metrics you want to include in your dashboard.
You can then use the drag-and-drop functionality to move the selected data onto the dashboard canvas.
3. Customize the Dashboard
Once the data has been added, customize the dashboard according to your requirements.
You can arrange the different elements and prioritize the information that you frequently use for analysis.
For example, an SEO dashboard could include website traffic, engagement, landing page performance, conversions, and key events.
4. Save and Publish
After completing the dashboard, save your configuration. If necessary, you can also publish the dashboard so it can be used as part of your regular reporting and monitoring process.
How the Dashboard Can Save Time
The new Google Analytics Dashboard can help reduce the amount of time required to find and review specific reports.
For SEO analysts, webmasters, digital marketers, and website owners, having frequently monitored metrics in one place can make daily data analysis more efficient.
Instead of opening individual reports one by one, users can create a dedicated dashboard containing the information they need most often.
Important metrics could include key events, traffic, engagement, acquisition, landing page performance, and conversions.
With the right configuration, the dashboard can serve as a centralized monitoring area for tracking website performance.
Conclusion
The new Dashboard feature in Google Analytics gives users greater flexibility when organizing and viewing their analytics data.
With features such as custom layouts, grid-based positioning, drag-and-drop functionality, dimensions, and metrics, users can create a reporting view that fits their specific needs.
For professionals who regularly work with website data, particularly SEO analysts and webmasters, a customized GA4 Dashboard can be a practical way to streamline monitoring and make everyday analysis more efficient.
References:
Tagged with:
Google Analytics
An SEO Specialist & PR Strategist with over 6 years of experience in outreach guest posting, link building, and content marketing. Focused on building brand awareness through measurable digital marketing strategies. With a background in journalism and a wide professional network.